Engineered Preparedness scores the real threats facing every U.S. county and puts them on free, interactive maps. For reporters, that's a ready-made local angle, an independent expert source, and data you're welcome to use — no fear-mongering, no paywall, no agenda.
We rank the actual threats for every U.S. county — floods, fire, wind, winter, quake, and human-caused risks — so a reporter anywhere can answer "what should our readers be ready for?" with real numbers, not national averages. Tell us a county and we'll pull the figures.
Free, interactive tools — a county Threat Report, a national risk map, and models for nuclear fallout, EMP, hurricanes and more — that you can link readers to directly. No signup wall for the core tools.
A working engineer and published author who talks about preparedness as a measured discipline — risk, numbers, and planning — not doom. Available for background, data, and written commentary, often same-day on a breaking event.
The evergreen local-news segment. Point readers at the county Threat Report, or give us your county and we'll hand you the ranked list and the one-line "why" for each.
FEMA's National Risk Index measures expected dollar losses, not human exposure — which is how New Orleans scores near the 0.1 percentile for flood risk. We built a model that asks a different question, and the gap is a story. (We can walk you through the methodology.)
Hurricane season, the first winter storm, wildfire season, National Preparedness Month in September — each is a natural hook, and we have the county-level data and checklists to localize it.
You're welcome to reference our maps, rankings, and tool results in your reporting, and to link readers to any public tool. If you need a figure for a specific place — a county's threat ranking, flood exposure, or a custom cut of the data — just ask and we'll pull it for you, usually within a day.
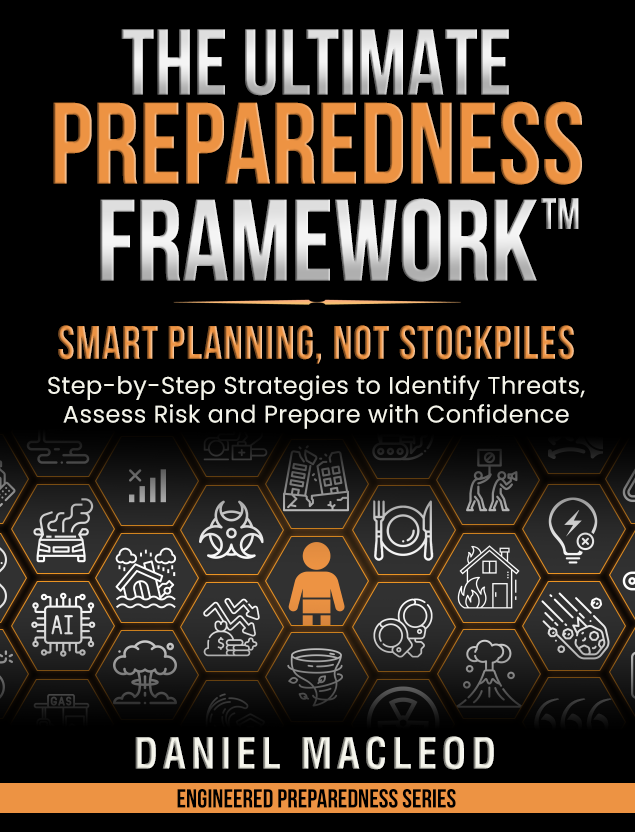
Daniel is an engineer with more than 20 years across industry and a lifelong prepper, and the author of The Ultimate Preparedness Framework™. He built Engineered Preparedness to turn a military-style area study — identify the threats you actually face, then plan for them — into free software anyone can use.
He writes under a pen name by design, and the work is deliberately independent: no ads, no tracking, no gear sponsorships, no doom-content channel. That makes him an unusually candid source — he's not selling fear or a survival kit. He's available for background, data, and written or phone commentary, attributable to Daniel MacLeod of Engineered Preparedness.
Interviews, data requests, a county pull for a story, or fact-checking — all go to one inbox, and press notes get a fast reply.
On a deadline? Say so in the subject line and we'll move.