Many threats — the economy, the grid and the fuel supply, weather and natural hazards, disease, unrest at home, and conflict abroad — each read from public data and scored against its history. The question behind every number is the same one: how unusual is this? Not a forecast, and not anybody's opinion of how worried you should be. Open a sector for the readings behind the gauge, the history under each one, and the map of where it is happening.
This is not an emergency service. The dashboard is informational only — it does not monitor your home, dispatch help, or replace official alerts. In a life-threatening emergency, call 911 and follow guidance from local authorities and NOAA/FEMA.
The paid tiers run your saved counties against every developing event — a hurricane that misses you by 600 miles never lights your board.
News volume is not threat level. Each gauge scores real signals against the framework's math, not against what's trending.
Every sector links straight to the brief, the map and your plan — or honestly reads "nothing to do yet."
Attention is not threat level — the gauges above are the assessment. But a sudden surge in coverage is an early tripwire worth a look. These track how fast preparedness-relevant terms are moving across the news we monitor, built from our own corpus. No social-media data is involved.
A behind-the-scenes read of what's moving — anomalies and regime changes already in motion, ranked from the dashboard's own signals and explained in plain language. These are watch items, not predictions: they flag what's unusual and accelerating, never what will happen. Informational only; not an emergency service.
 Deep Dive
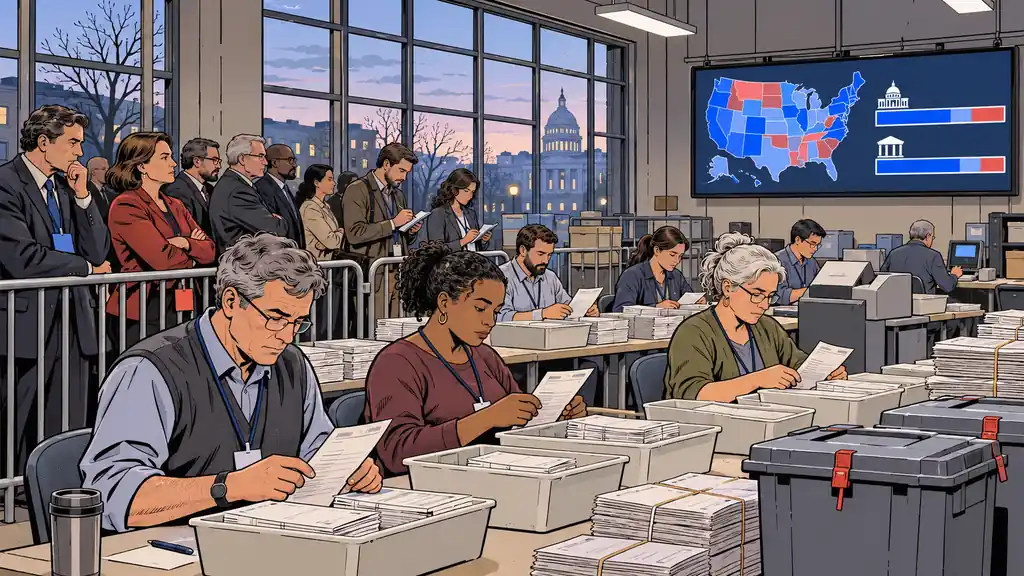
While it's impossible to know the long-term ramifications of the 2026 mid-term election, we can identify several short-term likely results.
 Deep Dive
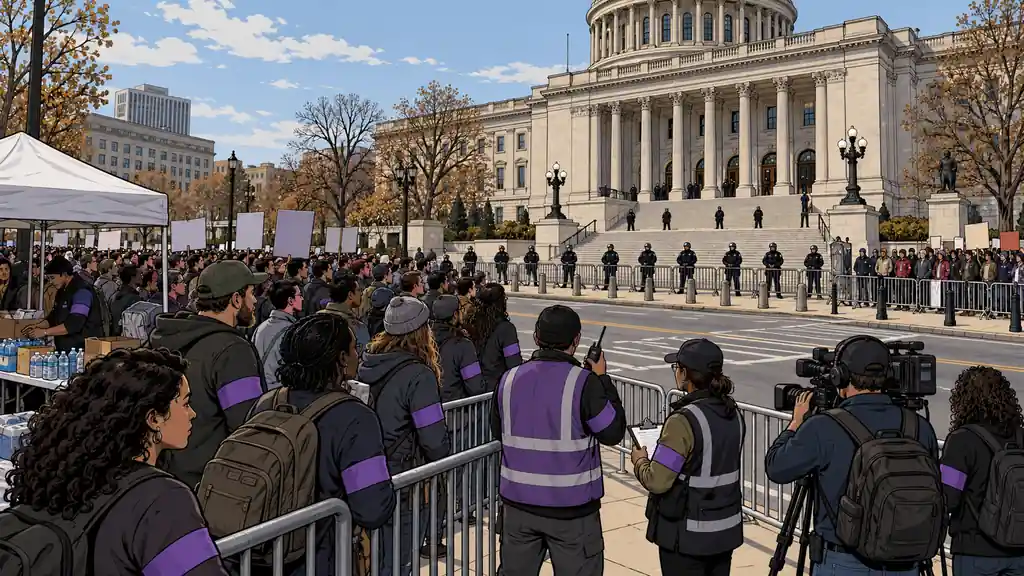
Several groups appear to be attempting exactly this, with counter-preparations becoming more visible as well. If carried out, it may mean the US is heading toward a very tumultuous November and December.
 Deep Dive
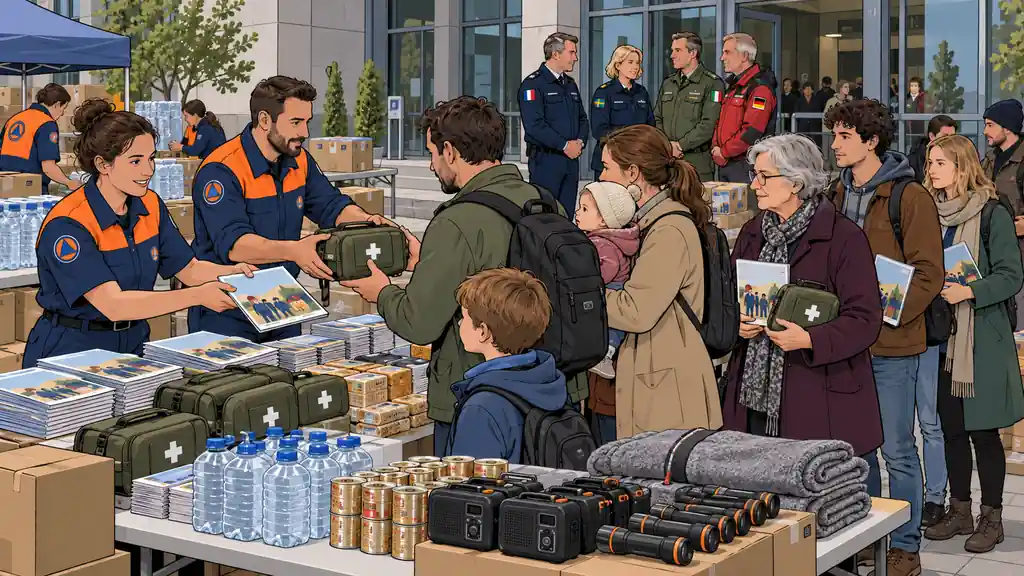
Encouraging preparedness is common by most countries. Is the recent declarations by multiple nations normal or is something deeper going on?
